 2016, Vol.3


2. Pacific Northwest National Laboratory, Seattle WA 98109, USA
Nontology is a representation of knowledge formed by a set of controlled vocabulary of concepts with explicitly defined and machine-processable semantics,and the relationships between the concepts[1, 2]. Ontologies represent a structured view of the domain containing rich semantic meanings,thus play an important role for various knowledge-intensive applications[3, 4, 5]. In recent years,the size and diversity of semantic datasets have been growing dramatically,which increase the computation load significantly and makes the analysis of ontologies and the represented knowledge graph very hard. For example,DBpedia 3.9 version contains nearly 16 million instances (concepts; nodes in the graph),and nearly 170 million mapping statements (relationships between concepts; edges in the graph). The large size of these graphs causes multiple problems when we analyze the topology of graphs themselves,as well as using these datasets. For example,when we use linked data as the knowledge base in various applications,ingesting the full data with all instances and mapping statements is infeasible due to two reasons: 1) the existence of huge amount of redundant and unrelated data,and 2) the huge computational complexity because of the size of data. Therefore,the normal practice is to extract a sub-graph of the knowledge graph based on the ontology,so that we can take advantage of relevant information without the need to deal with the whole knowledge graph. Therefore,in order to effectively and efficiently analyze such huge graphs,there is a crucial need to find proper methods to reduce the computation load without losing too many details of the data. One of the intuitive ways is to reduce the size and complexity of ontologies through appropriate sampling based on the topology and instance types,which can subsequently reduce the size of represented knowledge graph. In addition,there is usually an explicit hierarchical structure in the ontologies of various applications (for example,please refer to the biomedical ontologies in Figs. 1,3,and 4). This hierarchical structure indicates the potential to perform the sampling work based on the semantic hierarchy of the ontologies. The aforementioned needs and observations motivate us to study how to identify and use these inherent semantic structures and hierarchies to discover new insights and optimize existing services.

|
Download:
|
| Fig. 1. A close look at part of Yeast GO slim. | |

|
Download:
|
| Fig. 2. Made-up ontologies: fungus ontology on the left; plant ontology on the right. | |

|
Download:
|
| Fig. 3. Plant, Yeast and Candida GO slims. $N$: number of nodes; $E$: number of edges; part_of: proportion of part_of relationship; is_a: proportion of is_a relationship; regulates: proportion of regulates relationship. | |

|
Download:
|
| Fig. 4. Different scaling layers/levels of Plant, Yeast, and Candida GO slims. | |
To address this challenge,Al-Saffar et al. proposed two related methods: extant ontology and ontological scaling[6]. Extant ontology is derived from the original ontology based on the statistical prevalence of edges between nodes in the graph. It was initially introduced to provide a visualization of the graph with the percentage of relations between certain node types. Besides,extant ontology can also be applied to data mining tasks (like clustering) and identifying patterns at different levels of abstraction. The second method,ontological scaling,uses the ontology as a hierarchical scaling filter to adjust different resolution levels at which the graph structure of the data is being visualized and analyzed[6]. In particular,Al-Saffar et al. proposed to use a scaling ontology as a selector ``knob'' to decide on what data to be filtered out to achieve the desired resolution in visualization and the analyses of the data. Using a scaling ontology,researchers are able to replace a large number of subclasses with a smaller number of immediate or higher-level super classes. In this way,the scaling ontology can be used as a controlling mechanism to decide on the scaling level of trade-offs between computation load and resolution of the results. They have shown that even in diverse and huge datasets with hundreds of thousands of classes and predicates,only a small portion of them is necessary to cover the entire dataset[6].
Similar ideas as ontological scaling proposed by Al-Saffar et al. have been applied in information visualization domain for visualizing multi-dimensional complex networks,particularly social networks[7, 8, 9, 10, 11]. However,to the best of our knowledge,most existing efforts have been focused on visualization of knowledge graphs. There is no empirical research assessing the capability of employing scaling ontologies in the analytics of data from real-world applications.
In this research,we present the first effort of examining the capability of ontological scaling in analyzing the semantic similarity of biomedical ontologies. Biomedical ontologies represent gene terms,gene functions,biological processes,and cellular components of cells as knowledge graphs. These biomedical ontologies enable the use of computational algorithms,methods and tools to analyze the functions of genes and proteins. Among various applications of biomedical ontologies,the measure of semantic similarity between ontology terms is playing an important role in the in-depth understanding of the functions of a set of gene and protein terms and the relations among them. Measuring the semantic similarity is able to help the systematic analysis of gene and protein data. However,due to the large size of biomedical ontologies,the computation of semantic similarity value is usually a huge and time-consuming work. In order to address this issue,we design and perform a set of experiments with ontological scaling and aim to answer the following question in this paper: is ontological scaling able to significantly reduce the size of ontologies while still capturing enough valuable information to interpret the original ontologies? We perform comparative assessment studies of the relationship between scaling biomedical ontologies at different levels and the semantic similarity values. In particular,we evaluate whether the similarity values at different ontological scales are still reasonable and coherent with results without scaling. The results of this study demonstrate that with proper selection of ontological scaling levels and the similarity measures,we can significantly reduce the size of ontologies without losing substantial detail. This study provides a deeper understanding of the application of semantic similarity to biomedical ontologies,and shed light on how to choose appropriate semantic similarity measures for biomedical engineering.
The organization of this paper is as follows. First,we conduct a brief survey of the semantic similarities in biomedical ontologies and introduce the dataset in this research. Then we present the design and framework of experiment in Section III. The results are reported in Section IV with discussions of findings in discussion section. Finally,we conclude the paper with remarks for future work in Section V.
Ⅱ. SEMANTIC SIMILARITY OF BIOMEDICAL ONTOLOGIES A. Semantic SimilaritySemantic distance is a measure that assesses the extent of similarity between two entities,and semantic distance is the inverse of semantic relatedness or semantic similarity[12, 13, 14]. All three terms ask the same question: ``How much does term A have to do with term B?'' Thus much of the literature uses semantic relatedness and semantic similarity interchangeably. However,it is worth noting that semantic relatedness covers a broader range of relationships that includes semantic similarity,and other concepts as metonymy and antonymy[13]. In this paper,we use semantic similarity for consistency.
The most common measures of semantic similarity were originally developed for WordNet and linguistics research[12, 15, 16, 17, 18],and then successfully applied in other fields like biomedical engineering,bioinformatics,and geoinformatics[19, 20].
Measures of semantic similarity are based on the topology of ontologies. There are two major strategies for comparing terms: edge-based and node-based. Node-based approaches use nodes and their properties as the main data sources. Edge-based approaches use edges and their properties. In addition,there are two major strategies for comparing sets of terms: pairwise and groupwise. For pairwise approaches,the similarity between two sets of terms is measured by combining the similarity values between their terms. On the other hand,instead of calculating the similarity by combining the similarity of their terms,groupwise approaches choose one of three representation methods: set,graph,or vector. In this research,we choose four common node-based measures and calculate the set similarity using pairwise strategy: Resnik[16],Jiang-Conrath[17],Lin[18],and SimRel[21]. Because edge-based measures are sensitive to several irregularities (variable edge length,variable depth,variable node density,etc.)[19],the selected measures are all node-based measures. These measures rely on the concept of information content (IC),which measures how specific and informative a term $c$ is using the negative log likelihood:
| $\begin{align} IC(c)=-\log p(c). \end{align}$ | (1) |
In (1),log $p(c)$ represents the probability of term $c$ in a specific corpus (usually a knowledge base).
the resnik measures the semantic similarity of two terms $c_{1}$ and $c_{2}$ as the ic of their most informative common ancestor (mica):
| $\begin{align} sim_{Res}(c_1,c_2)=IC(c_{MICA})=-\log P(c_{MICA}). \end{align}$ | (2) |
Both the Lin and the Jiang-Conrath take the IC of $c_{1}$ and $c_{2}$,and the distance from their common ancestor into consideration,and revise the Resnik measure as follows:
| $\begin{align} &sim_{Lin}(c_1,c_2)=\frac{2\times IC(c_{MICA})}{IC(c_1)+IC(c_2)}, \end{align}$ | (3) |
| $\begin{align} \\ &sim_{jc}(c_1,c_2)=\frac{1}{IC(c_1)+IC(c_2)-2\times IC(c_{MICA})+1}. \end{align}$ | (4) |
The Relevance(SimRel) measure further combines Lin and Resnik to make use of the information of both distance and placement in graph as follows:
| $\begin{align} sim_{Rel}(c_1,c_2)=sim_{Lin}(c_1,c_2)\times [1-p(c_{MICA})]. \end{align}$ | (5) |
Due to the length limit,we do not further describe the semantic similarity and its measures in detail. Comprehensive reviews of these approaches and their applications are given in a number of publications[14, 19, 20, 22]. Please also refer to Section IV for further discussion with results of experiments.
B. Biomedical OntologiesThe amount and diversity of data for biomedical research has been growing fast. A variety of biomedical ontologies for the annotations of gene products,sequences,and experimental assays have been developed as uniform and objective knowledge representations[19, 23]. With the adoption of these ontologies,researchers are able to compare entities on aspects,which could not be compared by other means. In the past decade,semantic similarity has been applied to various biomedical research,including identifying biological roles of proteins and genes,exploring functions of genes,and validating the results drawn from other biomedical studies such as gene clustering,gene expression data analysis,etc.[19, 22, 23, 24, 25].
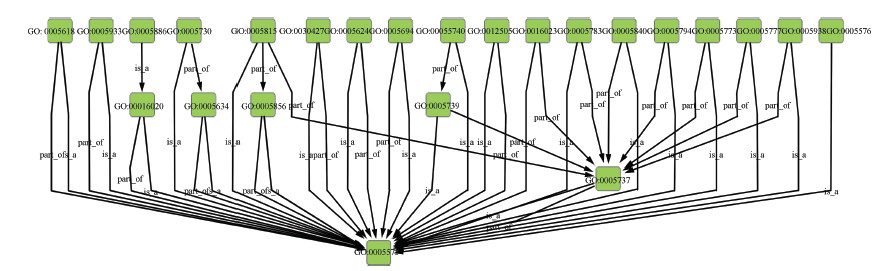
The gene ontology (GO) project aims at standardizing the representation of gene and gene product attributes across species and databases[26]. GO provides a controlled vocabulary of terms for representing gene product function in the cellular context,and tools to access and process this data. Because comparing gene products at a functional level is crucial for various applications,GO has been widely adopted by the life sciences community and has become a major focus of investigation of semantic similarity in molecular biology[19]. In addition,GO slims are ``cut-down'' versions of the GO ontologies,which contains a subset of the terms in the whole GO. GO slims allow researchers to annotate genomes or sets of gene products to have a high-level view of gene functions. Fig. 1 shows a close look at part of the GO slim for yeast. Each node represents a unique gene term,and edges between two nodes represent the relationship between two gene terms (part_of,is_a,etc.).
Ⅲ. EXPERIMENTIn this section,we first use two small made-up ontologies (Fig. 2) as a running example to explain the basic notions and the basic steps of our experiment. Then,we introduce the dataset we used. Next,we formally present the ontological scaling methods and the results of scaling ontologies in our dataset. Then we describe the flow of experiment and discuss the expected results.
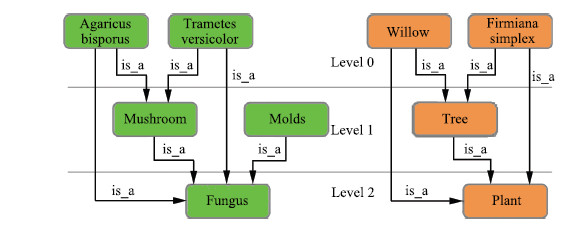
A. Running ExampleLet us consider two made-up ontologies as shown in Fig. 2. ontology green (fungus) has 4 nodes,and ontology orange (plant) has 3 nodes. There is only one type of relations between concepts in this example,namely is_a. The top level is level 0,representing that no nodes have been excluded (the original ontology without scaling). Level 1 means that the nodes on top have been excluded. Level 2 means that the nodes on top two levels have been excluded.
The basic flow of our experiment is as follows (please also refer to Fig. 6):

|
Download:
|
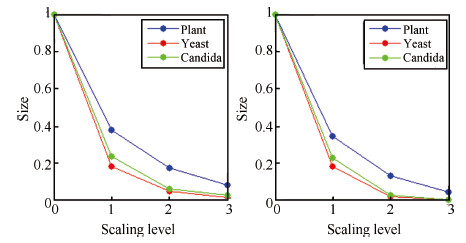
| Fig. 5. Fraction of nodes (left) and edges (right) in each scaling level. | |

|
Download:
|
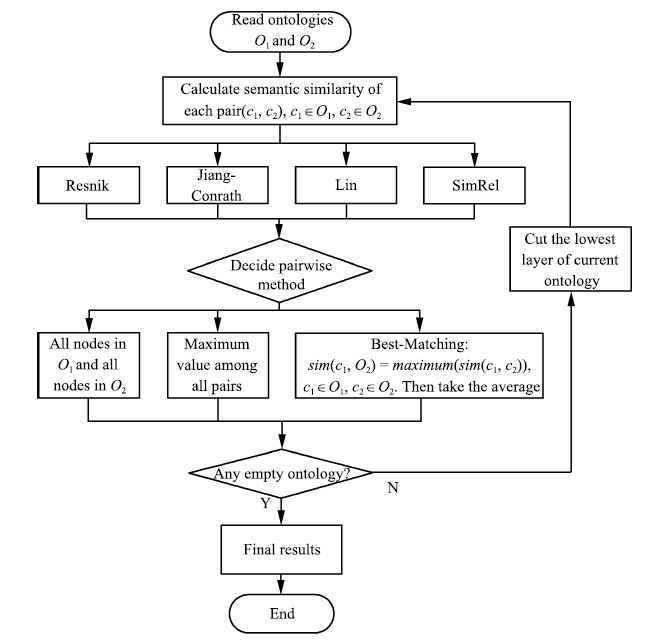
| Fig. 6. Flowchart of the experiment | |
First,we obtain the semantic similarity values between each pair of two nodes in the two ontologies using four measures: Resnik,Jiang-Conrath,Lin,and SimRel (please refer to the formulas in the previous section).
Second,we use all three pairwise methods (average of all pairs,the maximum semantic similarity score of all pairs,and the average of two best-matching pairs between the node in one ontology and all nodes in the other,and vice versa; for more details,please refer to Fig. 6) to calculate the aggregated semantic similarity between ontology green and ontology orange.
Third,we increase the scaling level by 1 (scaling level 0 to scaling level 1). We exclude all nodes on the very top (nodes only in level 0). ontology green has three nodes left: mushroom,molds,and fungus. ontology orange has two nodes left: tree and plant.
Fourth,we calculate the semantic similarity between two scaled ontologies (ontology green and ontology orange without nodes on the top) again using all the four measures and all the three pairwise methods.
Fifth,we increase the scaling level by 1 (scaling level 1 to scaling level 2). We exclude mushroom and molds from ontology green,and tree from ontology orange. Both ontologies have only one node left.
Sixth,we calculate the semantic similarity between two scaled ontologies (ontology green and ontology orange,both have only one node left) again using all the four measures and all the three pairwise methods.
Seventh,because there is only one layer left for each ontology,we could not do further scaling operations. The experiment stops here.
After the seven steps above,we compare the semantic similarity values between these two made-up ontologies at all the three levels: level 0,level 1,and level 2. We would like to see how much the semantic similarity value is changing while we are scaling from level 0 to 1,and 1 to 2. In this running example,the two ontologies describe two kingdoms. As we can observe,even we only keep one general node for each (fungus and plant),the semantic similarity between these two nodes may still capture the actual integrated semantic similarity between the two groups of nodes. We will also examine the performance of different measurements when we scale down the ontologies. In the following of this section,we will present the dataset and the design of experiment in a formal way.
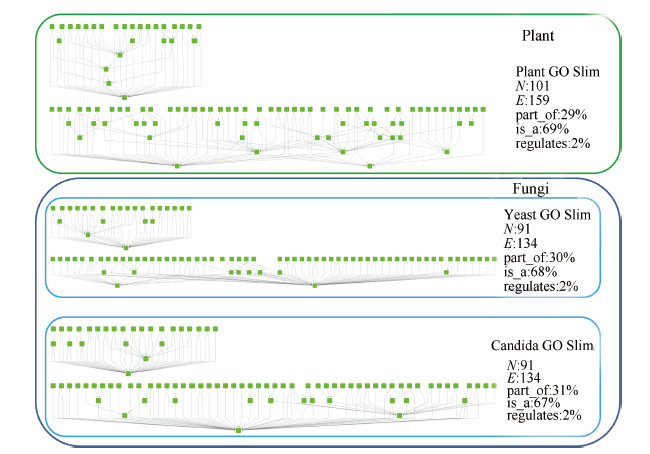
B. DatasetIn order to examine the capability of ontological scaling in biomedical applications,we choose three GO slims for our experiment: plant,yeast,and candida. The three GO slims contain all the three classes of ontologies: biological process,molecular function,and cellular component. Both yeast and candida belong to the same kingdom - fungi. Because candida is a genus of yeast and candida albicans is a diploid fungus (a form of yeast),yeast and candida GO slims are expected to be similar based on the biological taxonomy and the function of GO. On the other hand,plant belongs to a different kingdom-plantae,thus should be less similar as compared with yeast and candida. Therefore we are able to use this fact to evaluate the effectiveness of semantic similarity algorithms. Fig. 3 shows the three GO slims we selected,and basic topological properties.
C. Scaling LayersThere are four types of relationship between different nodes (gene terms) in the GO: part_of,is_a,has_part,and regulates. In the dataset of this study,there is no has_part relationship. For all three GO slims,the proportions of part_of,is_a,and relationship to build a hierarchy of ontologies to determine the ontological scaling layers. In particular,we propose the following incremental hierarchical rules,which are based on[27]:
1) For each node (gene term),the original layer label is 0.
2) If a node has other nodes pointing at it through a ``part_of'' link,then increment the layer label of this node,and its parental nodes by 1.
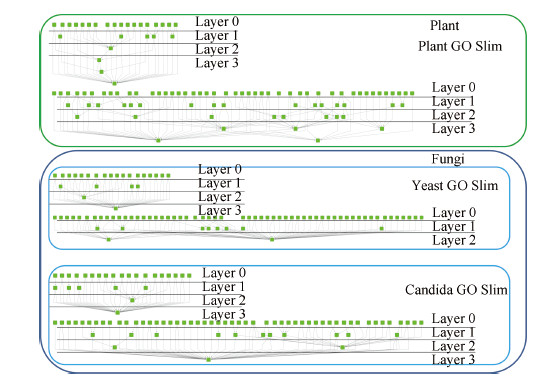
Fig. 4 shows the scaling layers of the three GO slims in our dataset. In our experiment,we use the term scaling level to denote how many layers have been excluded in ontological scaling. We scale down from lower layers until there is only one layer left in the ontology. Therefore,scaling level 0 means that the whole ontology is kept,and scaling level n means that n lower scales have been excluded. Fig. 5 shows the fraction of nodes and edges left at different scaling levels. It is observed that in all three GO slims,over 60% of the nodes and edges have been excluded by scaling down to layer 1,and only less than 10% are left after the third scaling levels. These statistics indicate a promising potential of using ontological scaling techniques to significantly reduce the computation load in the analysis of GO.
D. Flow of the ExperimentIn comparing the semantic similarity between two ontologies,we first select four common measures that have been successfully adopted in GO: Resnik[16],Jiang-Conrath[17],Lin[18],and SimRel[21]. In the second step,we select three major pairwise methods in calculating the set similarity from term similarity for (1) consistency and (2) avoidance of having too many comparing pairs. Fig. 6 is the flowchart of the experiments. For each pair GO slims,we first select one of the four measures to calculate the semantic similarity of nodes (gene terms). Then,we select one of the three pairwise methods to calculate the semantic similarity of two GO slims. Third,we exclude the lowest layer (layer 0) of both GO slims and go back to do the same calculations and operations with scaled GO slims. The process stops when either one or both of the two scaled ontologies have only one layer (with one node) left. In the experiment,we calculated the semantic similarities of four layers of three GO slim pairs (plant and yeast,plant and candida,and yeast and candida) using four different similarity measures and three different pairwise methods,in total we did the computation for $4 \times 3\times 4\times 3 = 144$ times. In this research,we used the FunSimMat toolkit to calculate the similarities using UniProKB 2010_10 and GOA release in October 2010[28].
Ⅳ. RESULTS AND DISCUSSIONSIn this section,we first show the actual semantic similarities of all GO slim pairs,and discuss whether the results are reasonable based on our assumptions above. Then,we calculate and compare the fluctuations/deviations of the semantic similarities of all GO slim pairs at different scales. Based on these results,we discuss the capability of adopting ontological scaling in the biomedical applications.
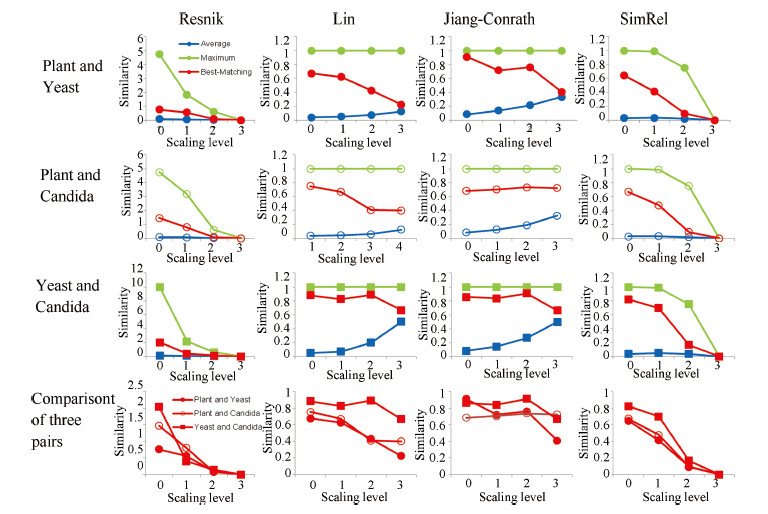
A. Comparison of SimilaritiesFig. 7 shows an overview of the results from our experiment. The horizontal axis is the scaling level,and the vertical axis is the semantic similarity values. Jiang,Lin,and SimRel normalize the results to [0,1],where 1 signifies very high similarity,and 0 signifies very low or no similarity. At scaling level 0 (no nodes are excluded),all four similarities indicate that yeast and candida are significantly more similar to each other as compared to other pairs of GO slims. In addition,the similarities for plant and yeast,and plant and candida are very close,both lower than yeast and candida. These observations validate our assumption that yeast and candida are more similar to each other based on biological taxonomy. In this research,we use this as one of the criteria to evaluate whether the results are reasonable from a biological perspective.

|
Download:
|
| Fig. 7. The similarity value of GO slims at different scaling levels. Horizontal axis is the scaling level, and vertical axis is the similarity values. Color of plots represents the pairwise method (blue: average; green: maximum; red: best-matching). Shape of plots represents the pair of GO slims (dot: Plant and Yeast; circle: Plant and Candida, square: Yeast and Candida). | |
From the first three rows of plots in Fig. 7,it is observed that,even after more than one scaling operations,Lin and Jiang-Conrath similarities are relatively stable. On the contrary,the Resnik and SimRel similarities drop fast with scaling to higher scaling levels. In addition,when we compare the results for different pairs (the last row of plots in Fig. 7),we can find that both of Lin and Jiang-Conrath were still able to indicate that the pair of GO slims yeast and candida is more similar,while Resnik and SimRel fail to be consistent to this criterion and the plots of three pairs (the last row of figures in Fig. 7) become intertwined. As the trends of three pairwise methods are similar,we only show best-matching plots in the last row of Fig. 7 to save space.
B. Comparison of FluctuationsTo gain a better understanding of the performance of the four measures at different ontological scales,we further study the ``fluctuations'' of similarities along with scaling the ontologies at different levels,as shown by Fig. 8. As best-matching has been proven to be the most reliable pairwise method[19],we only show the results calculated using best-matching method.

|
Download:
|
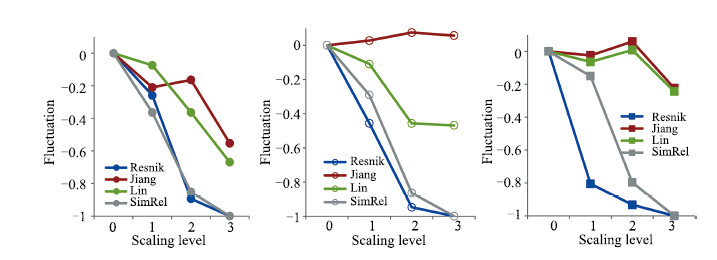
| Fig. 8. Fluctuation of different measures at different ontological scaling levels (pairwise method: best-matching). From left to right: Plant and Yeast, Plant and Candida, Yeast and Candida. | |
We define the ``fluctuations'' as the normalized deviation,which is the deviation from the original value without scaling (scaling level 0) normalized by the original value (Fig. 8). Similar to the observations in the above comparison,the absolute value of fluctuation of Resnik and SimRel continues to grow,and at the third scaling level,it is close to 100% from the original value without scaling. The performances of Lin and Jiang-Conrath are significantly better than Resnik and SimRel,with a very small fluctuation at the first scaling level. For plant and candida,and yeast and candida,both Lin and Jiang-Conrath are able to be stable. In particular,the performance of Jiang-Conrath is more stable. The absolute value of fluctuation of Jiang-Conrath is less than 10% after scaling off two levels of ontologies. In addition,the fluctuation of Jiang-Conrath shows an interesting converging trend to 0 in all pairs,indicating a potential to be stable with more ontological scaling operations.
C. DiscussionsThe findings shed light on the understanding of the tradeoff between ontological scales and details of the data. The experiment suggests that with only one scaling operation,researchers can reduce the size of data by 60%,and still have the similarity value very close to the original value. To be more specific,when we select SimRel as the measure and best-matching as the pairwise method,the fluctuation is around 5% at the first scaling level. At the second scaling level,we can choose Jiang-Conrath to have a similarity close to the original value (6%-16% deviation) with over 80% of data excluded. At the third scaling level,more than 90% of the data is excluded (indeed,some GO slims have only one node remaining). We still can use Jiang-Conrath to have a similarity with only 2%-22% deviation from the original value. What is more important is that the aforementioned strategies can produce results that are reasonable and coherent with biological taxonomy.
In general,among the four measures we tested in the experiment,Resnik and SimRel are not capable of measuring the semantic similarity of GO slims at different scales. Lin and Jiang-Conrath are relatively more stable and reliable. Jiang-Conrath shows unique capability to converge to the original value along with more scaling operations. The fluctuation of Jiang-Conrath continues to grow slowly,which is a more manageable measure.
It is worth noting that in other studies of biomedical ontologies,Jiang-Conrath and Resnik were often determined as better measures than Lin. However,the performance of Lin in this research is far better than Resnik,and comparable with Jiang-Conrath at the first and second scaling levels. This observation leads us to the important question: What are the key reasons of the better performance of Lin and Jiang-Conrath measurements in preserving the semantic similarity of GO with ontological scaling?
To answer this question,we need to go back to the survey of these measures and examine the formulas (2) to (5),and link to the characteristics of our dataset as well. As we can observe from Figs. 1,3 and 4,there is a very explicit hierarchical structure for the GO slims we used in this study. We can also observe that the size of GO slims reduces very fast when we increase the scaling levels,as shown in Fig. 5. On the other hand,in our experiment we compared GO slims of similar functions (Yeast,Candida,and Plant). Therefore,with each scaling operation,a large number of terms were removed together with their MICAs. This made the Resnik measure very unstable with ontological scaling,since the Resnik measure only calculated the information content of MICA of two terms,while did not consider the information content of the two terms being compared ($c_1$ and $c_2)$. This is also the reason of the poor performance of SimRel measure because it uses the probability of annotation of the MICA $p(c_MICA)$ as a weighting factor,which has a power-law relationship with $sim_Res(c_1,c_2)$,to the Lin measure.
On the other hand,both Lin and Jiang-Conrath measure have taken the information content of the two terms into consideration. This leverages the changes of the information content of MICA at different ontological scaling levels. Although SimRel is based on both Lin and Resnik,the weighting factor of $p(c_{MICA})$ has a very strong influence on the value. Therefore,although SimRel performed better than Resnik,the performance of it was still worse than Lin and Jiang-Conrath.
Summarizing the above discussion,semantic similarity measures with factors to leverage the influence of the information content of MICA are expected to have a better performance in analyzing GO with ontological scaling. The factors to leverage are usually the information content of the terms being compared (like Lin and Jiang-Conrath). It is worth noting that this conclusion is based on the specific ontological scaling method we used in this research. There could be more ways to reduce the size of ontologies other than ontological scaling. For example,sub-graph sampling/scaling methods in complex networks like k-shell (or k-core) are potentially useful in the analysis of GO. More in-depth understanding of the performance of different types of semantic similarity measures in biomedical ontologies with a variety of sub-graph sampling scaling methods is part of our ongoing research.
Ⅴ. CONCLUSIONSThis study is the first effort to examine the capability of ontological scaling via studying the relationship between scaling biomedical ontologies at different levels and the semantic similarity values. The results demonstrate that,with proper selection of scaling levels and similarity measures,we can significantly reduce the size of ontologies without losing substantial detail in measuring the semantic similarities of selected GO slims. This research provides an in-depth understanding of the application of semantic similarity to biomedical ontologies,and sheds light on how to choose appropriate semantic similarity measures for biomedical engineering.
With the encouraging results from this research,it is interesting to apply the ontological scaling techniques to more ontologies in biomedical research,and other domains. We strongly recommend semantic web and biomedical researchers to take the idea of ontological scaling and explore new opportunities to optimize their systems and propose new algorithms. One particularly interesting topic is the investigation of the effect of ontological scaling on aspects of the data other than semantic similarity. There are two major research questions in this research: 1) How to scale more complex ontologies with more types of properties and relationships? How to take advantage of the strong logical foundations of OWL (web ontology language)-style ontologies to propose more effective and efficient scaling strategies? 2) What are the new capabilities of ontological scaling besides reducing the computation load? For example,due to the different nature of applications,ontologies are often not consistent or complete,which causes difficulties in reasoning across ontologies (for instance,the data and ontologies published by governments of different countries in the linked open government data project[29]). Using ontological scaling techniques,the inconsistent ontologies can become consistent by scaling one or more ontologies. With successful finding of the scaling thresholds in which the ontologies cross over from inconsistent to consistent,researchers can bridge different inconsistent ontologies and extend more opportunities in semantic web researches.
We conclude this paper with highlights of our research plan following this work. First,we plan to conduct a more comprehensive study to find out what kinds of ontologies are more suitable to perform ontological scaling,in other words,what are the key characteristics of ontologies indicating that we can scale them down to a small portion without losing substantial details of data. The future study will also look at the factors that affect the performance of similarity measures,and what measures fit what types of ontologies. Next,we aim to improve existing semantic similarity measures towards two opposite directions: 1) better meet the ontological scaling needs for certain applications,and 2) perform well across different applications. Moreover,we plan to integrate topology,semantics,and ontological scales to develop a novel measure for semantic similarity.
ACKNOWLEDGMENTThe authors would like to thank the CASS-MT team at PNNL for their support while he was affiliated with PNNL.
| [1] | Berners-Lee T, Hendler J, Lassila O. The semantic web. Scientific American, 2001, 284(5): 34-43 |
| [2] | Maedche A, Staab S. Ontology learning for the semantic web. IEEE Intelligent Systems, 2001, 16(2): 72-79 |
| [3] | Maedche A, Staab S. Measuring similarity between ontologies. In: Proceedings of the 13th International Conference on Knowledge Engineering and Knowledge Management: Ontologies and the Semantic Web. Sigöuenza, Spain: Springer-Verlag, 2002. 251-263 |
| [4] | Allemang D, Hendler J. Semantic Web for the Working Ontologist: Effective Modeling in RDFS and OWL. San Francisco, CA, USA: Morgan Kaufmann Publishers Inc., 2008. 352 |
| [5] | Hendler J, Holm J, Musialek C, Thomas G. US government linked open data: semantic.data.gov. IEEE Intelligent Systems, 2012, 27(3): 25-31 |
| [6] | Al-Saffar S, Joslyn C, Chappell A. Structure discovery in large semantic graphs using extant ontological scaling and descriptive semantics. In: Proceedings of the 2011 IEEE/WIC/ACM International Conference on Web Intelligence and Intelligent Agent Technology (WI-IAT). Lyon, France: IEEE, 2011. 211-218 |
| [7] | Shen Z, Ma K L, Eliassi-Rad T. Visual analysis of large heterogeneous social networks by semantic and structural abstraction. IEEE Transactions on Visualization and Computer Graphics, 2006, 12(6): 1427-1439 |
| [8] | Dai B T, Kwee A, Lim E P. ViStruclizer: a structural visualizer for multidimensional social networks. In: Proceedings of the 17th Pacific-Asia Conference on Advances in Knowledge Discovery and Data Mining. Gold Coast, Australia: Springer, 2013. 49-60 |
| [9] | Giereth M O. An Architecture for Visual Patent Analysis [Ph. D. dissertation], Universitöatsbibliothek der Universitöat Stuttgart: Stuttgart, 2013. |
| [10] | Gomes F, Devezas J, Figueira A' . Temporal visualization of a multidimensional network of news clips. Advances in Information Systems and Technologies. Berlin Heidelberg: Springer, 2013. 157-166 |
| [11] | Kienreich W, Wozelka R, Sabol V, Seifert C. Graph visualization using hierarchical edge routing and bundling. In: Proceedings of the 3rd International Eurovis Workshop on Visual Analytics (EuroVA). The Eurographics Association, 2012. |
| [12] | Budanitsky A, Hirst G. Semantic distance in WordNet: an experimental, application-oriented evaluation of five measures. In: Proceedings of the 2001Workshop onWordNet and Other Lexical Resources, Second Meeting of the North American Chapter of the Association for Computational Linguistics. Pittsburgh, 2001. |
| [13] | Patwardhan S, Banerjee S, Pedersen T. Using measures of semantic relatedness for word sense disambiguation. In: Proceedings of the 4th International Conference on Computational Linguistics and Intelligent Text Processing. Mexico City, Mexico: Springer, 2003. 241-257 |
| [14] | Song X B, Li L, Srimani P K, Yu P S, Wang J Z. Measure the semantic similarity of GO terms using aggregate information content. IEEE/ACM Transactions on Computer Biological Bioinformatics, 2014, 11(3): 468-476 |
| [15] | Miller G A. WordNet: a lexical database for English. Communications of the ACM, 1995, 38(11): 39-41 |
| [16] | Resnik P. Using information content to evaluate semantic similarity in a taxonomy.In: Proceedings of the 14th International Joint Conference on Artificial Intelligence. San Francisco, CA, USA: Morgan Kaufmann Publishers Inc., 1995. 448-453 |
| [17] | Jiang J J, Conrath D W. Semantic similarity based on corpus statistics and lexical taxonomy. In: Proceedings of the 1977 International Conference on Research in Computational Linguistics (ROCLING X). Taiwan: China, 1997. 19-33 |
| [18] | Lin D K. An information-theoretic definition of similarity. In: Proceedings of the 15th International Conference on Machine Learning. San Francisco, CA, USA: Morgan Kaufmann Publishers Inc., 1998. 296- 304 |
| [19] | Pesquita C, Faria D, Falc-ao A O, Lord P, Couto F M. Semantic similarity in biomedical ontologies. PLoS Computational Biology, 2009, 5(7): e1000443 |
| [20] | Schwering A. Approaches to semantic similarity measurement for geospatial data: a survey. Transactions in GIS, 2008, 12(1): 5-29 |
| [21] | Schlicker A, Domingues F S, Rahnenföuhrer J, Lengauer T. A new measure for functional similarity of gene products based on gene ontology. BMC Bioinformatics, 2006, 7: 302 |
| [22] | Lord P W, Stevens R D, Brass A, Goble C A. Semantic similarity measures as tools for exploring the gene ontology. Pacific Symposium on Biocomputing, 2003, 8: 601-612 |
| [23] | Lee W N, Shah N, Sundlass K, Musen M. Comparison of ontologybased semantic-similarity measures. In: Proceedings of the 2008 AMIA Annual Symposium. American Medical Informatics Association, 2008.384-388 |
| [24] | Al-Mubaid H, Nguyen H A. Measuring semantic similarity between biomedical concepts within multiple ontologies. IEEE Transactions on Systems, Man, and Cybernetics, Part C: Applications and Reviews, 2009, 39(4): 389-398 |
| [25] | Couto F M, Silva M J, Coutinho P M. Measuring semantic similarity between gene ontology terms. Data and Knowledge Engineering, 2007, 61(1): 137-152 |
| [26] | Harris M A, Clark J, Ireland A, Lomax J, Ashburner M, Foulger R, et al. Gene ontology consortium. The gene ontology (GO) database and informatics resource. Nucleic Acids Research, 2004, 32(Database issue): D258-D261 |
| [27] | North S C. Incremental layout in DynaDAG. Graph Drawing. Berlin Heidelberg: Springer, 1996. 409-418 |
| [28] | Schlicker A, Albrecht M. FunSimMat: a comprehensive functional similarity database. Nucleic Acids Research, 2008, 36(Database issue): D434-D439 |
| [29] | Erickson J S, Viswanathan A, Shinavier J, Shi Y M, Hendler J A. Open government data: a data analytics approach. IEEE Intelligent Systems, 2013, 28(5): 19-23 |